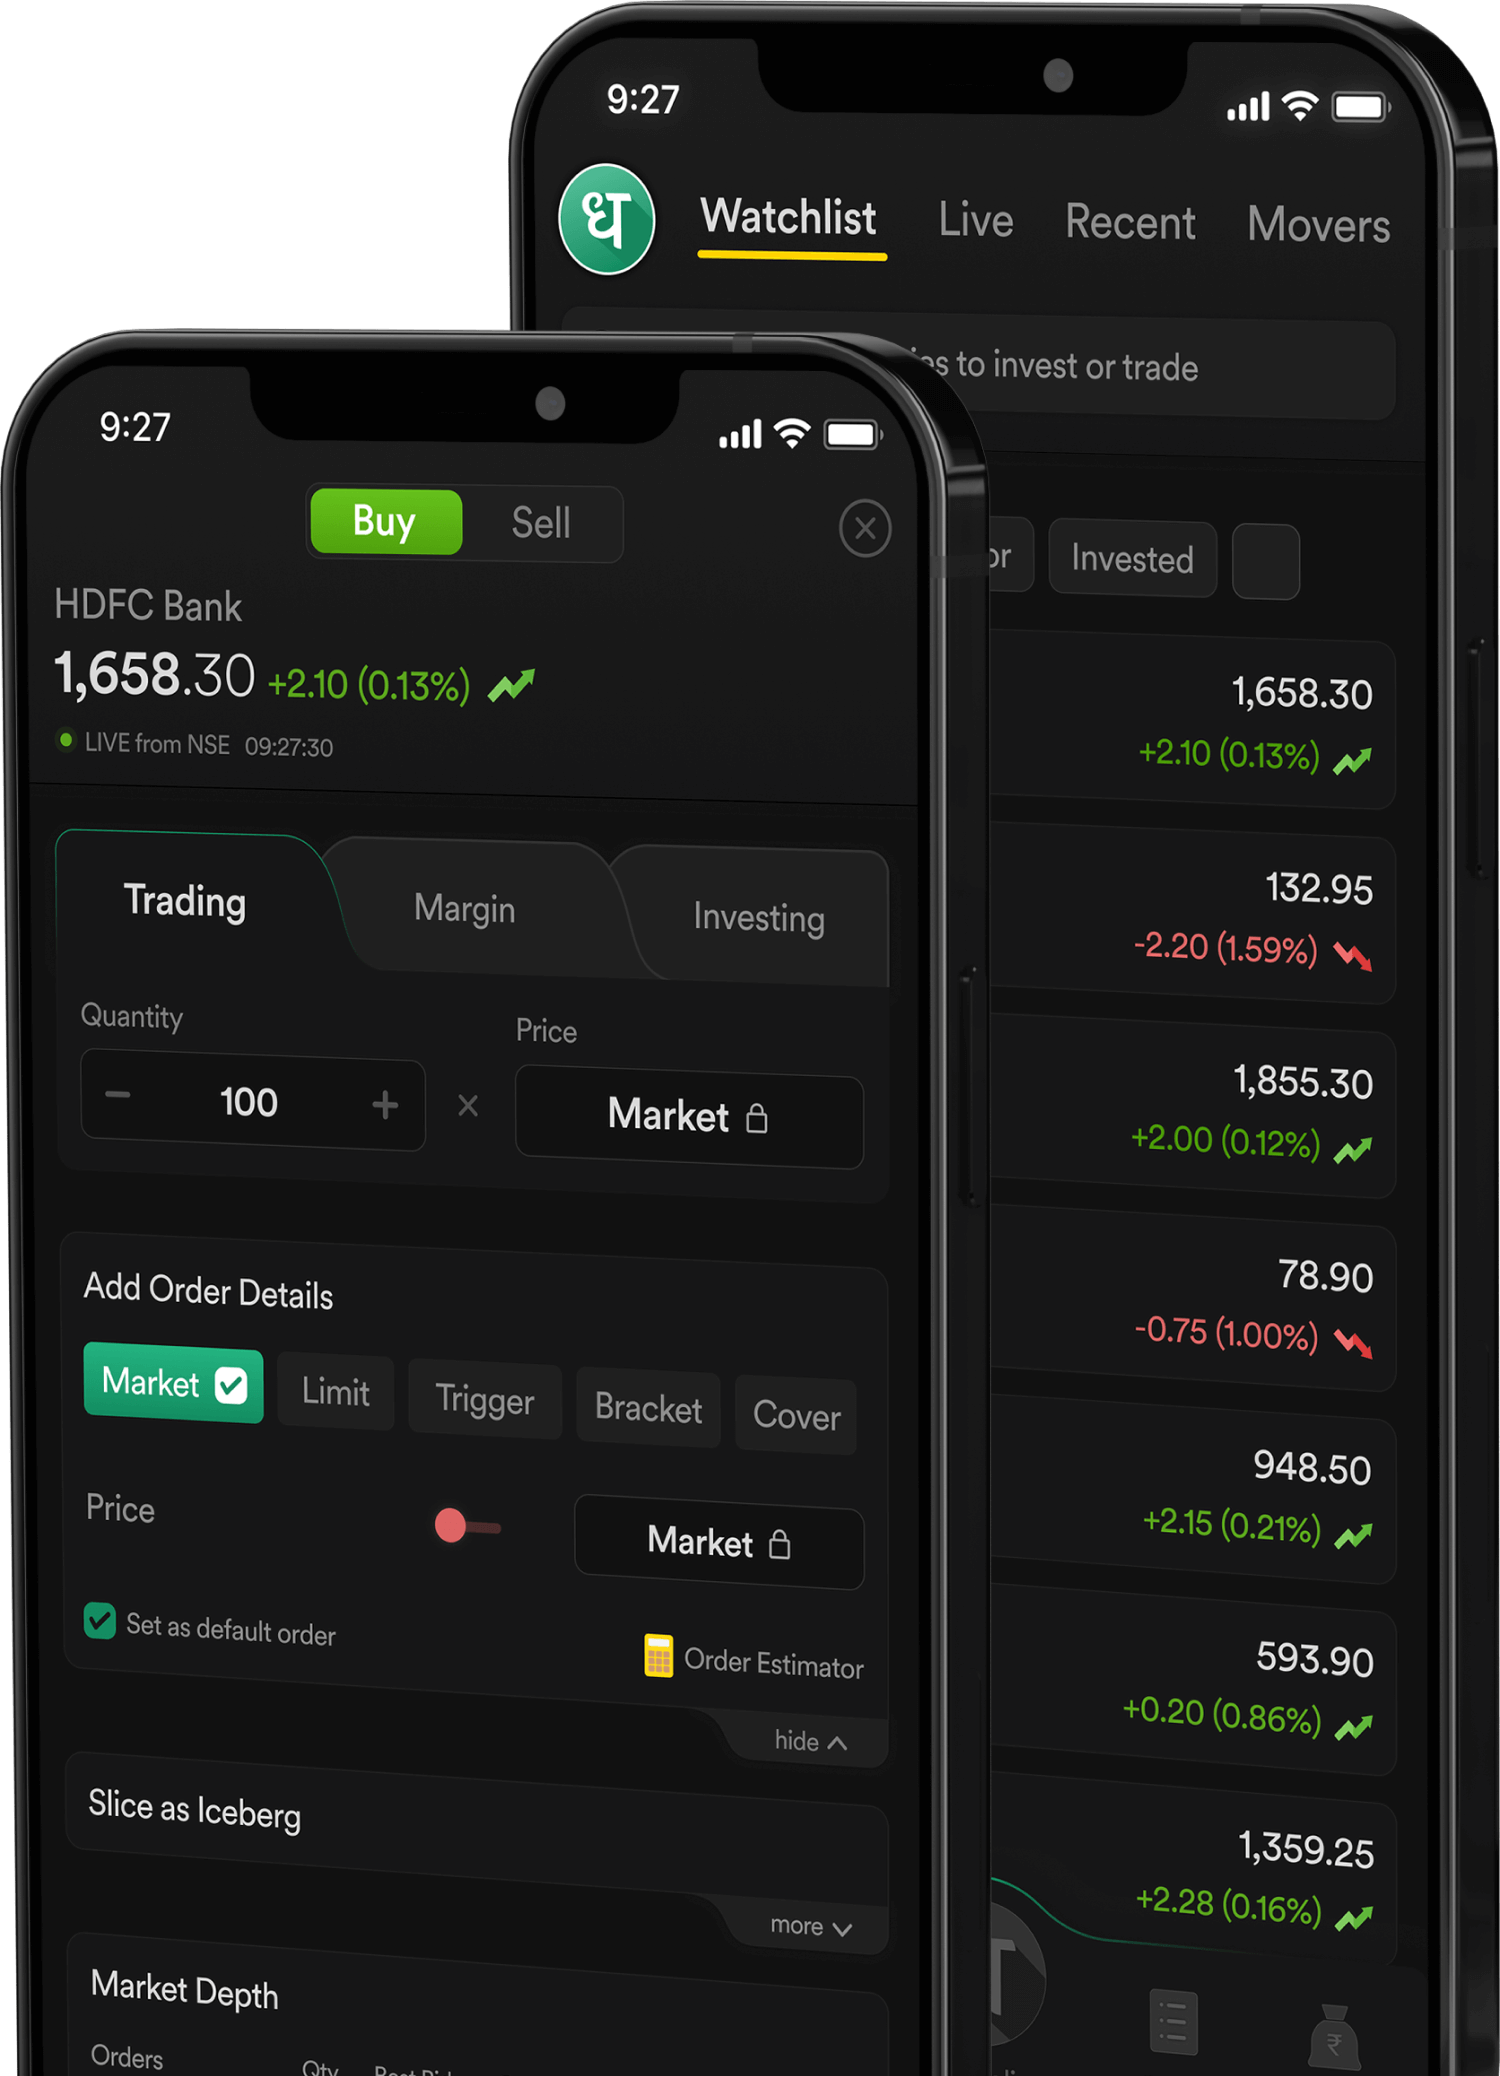
Dhan App
Stock Market App built for Super Traders & Long Term Investors.
Dhan Web
Web Trading Platform for those who love to trade from the big screen.
Options Trader App
Option Trading App built especially for India's F&O Traders.
Options Trader Web
Option Trading Platform to build, analyze, & execute F&O trades.
Trade from tv.dhan.co
Trade with TradingView Chart features for FREE on tv.dhan.co.
Connect to TradingView
Connect Dhan to TradingView - Place orders from tradingview.com
DhanHQ Trading APIs
Trade with Algo, Connect Apps, Build Services using APIs for FREE.
smallcases on Dhan
Build wealth with smallcase investment for FREE on Dhan.
Margin Trading Facility
Trade and invest with 4X Margin Funding on 1000+ stocks.

ScanX Stock Screener
50+ Readymade Screeners, Live Market Insights & Instant Trade Execution.
Stocks
MTF, Instant Pledge, & more for online stock trading.
Commodity
Dashboard, Pledge Margin, & Charts for commodity trading.
Options
Strategy Builder, Flash Trade, & Margin for options trading.
Futures
Charts, Futures Chain, & Margin for futures trading.
ETFs
SIP, Forever Order, & Draft Order for investing in ETFs.
Mutual Funds
Invest in top rated direct mutual funds at 0% commission.
IPO
Apply for Upcoming IPO, Open IPO and SME IPO using mobile UPI in seconds!

NFO
Apply for NFOs directly at no extra cost.
- Indices
- Stocks
- Mutual Funds
- ETFs
- Tools & Calculators

Pricing
Open Free Demat with ₹0 AMC for Life-time! Get detailed pricing here.

Dhan Support
Browse through most commonly asked questions and get answer instantly.

Indicator by Dhan
Your bi-monthly trading deep dive into markets, insights, and strategies.
MadeForTrade Community
Be a part of India’s most active community of Super Traders & Long-Term Investors.

Filter Coffee
We send a 2-minute email newsletter every morning with finance news to start your day.


 Gift Nifty


