
BSE IPO Stocks
Last Updated on 2026 Feb 12 at 22:41
Here you explore the list of all initial public offerings (IPOs) on the Bombay Stock Exchange. This list includes companies that have recently gone public, offering new opportunities for investors to participate in potentially lucrative offerings. It's a crucial tool for those interested in the dynamics of new market entrants and seeking to diversify their portfolios with fresh stocks.Here you can find a list of top stocks and popular index stocks related to the BSE.
BSE IPO Companies

3,107.60 | 2.07% | 7,94,149 | ₹ 1,53,595.78 | 56.77 | 9.11 | 3,128.25 | 2,528.90 | 16.63% | 20.14% | 20.14% | 20.14% | 20.14% | 2.08 | 1.43% | - | 98.60% | - | - | - | 67.71 | - | - | |
357.30 | -0.06% | 10,91,468 | ₹ 1,51,669.17 | 34.31 | 9.11 | 367.65 | 315.00 | -0.71% | 9.70% | 8.14% | 8.14% | 8.14% | 3.52 | 0.11% | - | 9.08% | - | 342.23 | - | 58.93 | - | - | |
179.65 | 4.42% | 69,91,212 | ₹ 1,10,908.66 | 62.34 | 9.11 | 193.91 | 112.02 | 13.02% | 37.20% | 37.20% | 37.20% | 37.20% | 12.60 | - | - | 49.28% | - | 160.66 | - | 62.55 | - | - | |
1,470.10 | -3.17% | 1,78,721 | ₹ 99,786.33 | 46.77 | 10.68 | 1,736.40 | 1,300.40 | 4.74% | -11.76% | -12.98% | -12.98% | -12.98% | 17.26 | - | - | 45.23% | - | 1,490.32 | - | 49.37 | - | - | |
513.00 | 10.00% | 37,22,952 | ₹ 88,998.84 | 272.72 | 79.85 | 495.00 | 355.70 | 12.03% | 23.48% | 27.20% | 27.20% | 27.20% | 9.78 | - | - | 6.18% | - | 441.39 | - | 69.15 | - | - | |
153.10 | -0.94% | 1,05,037 | ₹ 69,096.04 | -27.02 | 41.51 | 254.65 | 153.95 | -10.26% | -10.05% | -10.05% | -10.05% | -10.05% | 13.16 | - | - | -95.95% | - | - | - | 42.06 | - | - | |
716.00 | -0.67% | 35,821 | ₹ 59,417.06 | 27.50 | 9.11 | 891.65 | 687.75 | -4.28% | -2.17% | -14.85% | -14.85% | -14.85% | 3.27 | 0.40% | - | 9.35% | - | 742.01 | - | 44.91 | - | - | |
702.90 | 1.61% | 13,375 | ₹ 39,475.57 | 80.16 | 2.17 | 873.25 | 579.45 | 11.70% | 3.25% | -3.76% | -3.76% | -3.76% | 14.12 | - | - | 26.89% | - | 642.71 | - | 71.90 | - | - | |
543.95 | -4.90% | 1,00,185 | ₹ 33,236.21 | 25.54 | 29.69 | 900.15 | 560.55 | -25.71% | -18.01% | -28.79% | -28.79% | -28.79% | 5.53 | 2.00% | - | 26.56% | - | 720.58 | 751.08 | 20.49 | 65.00% | - | |
100.40 | -6.43% | 9,32,458 | ₹ 28,711.31 | -126.24 | 41.51 | 162.05 | 106.10 | -22.32% | -35.31% | -35.31% | -35.31% | -35.31% | 6.76 | - | - | -6.36% | - | 126.99 | - | 27.65 | - | - | |
713.95 | -0.28% | 1,44,317 | ₹ 27,230.57 | -42.04 | 8.70 | 790.00 | 287.30 | 12.94% | 8.18% | 136.02% | 136.02% | 136.02% | 10.06 | - | - | -75.66% | - | 671.71 | - | 60.50 | 50.00% | - | |
213.00 | -2.96% | 4,91,755 | ₹ 23,600.22 | 118.65 | 41.51 | 302.00 | 197.60 | -7.01% | -21.55% | -11.97% | -11.97% | -11.97% | 5.13 | - | - | 6.14% | - | 235.51 | - | 40.77 | 60.00% | - | |
205.25 | -1.56% | 2,34,748 | ₹ 23,568.37 | 992.86 | 53.59 | 283.70 | 207.20 | -7.98% | -18.32% | -18.32% | -18.32% | -18.32% | 4.13 | - | - | -1.53% | - | 231.11 | - | 32.49 | - | - | |
576.10 | 0.76% | 61,516 | ₹ 23,251.64 | 41.70 | 113.79 | 589.50 | 437.85 | 11.51% | 17.28% | 17.28% | 17.28% | 17.28% | 14.33 | 1.96% | - | 44.79% | - | 512.07 | - | 63.52 | - | - | |
971.70 | -0.29% | 4,06,471 | ₹ 19,434.00 | 52.25 | 41.51 | 1,425.00 | 880.00 | -6.50% | -8.35% | 3.81% | 3.81% | 3.81% | 9.00 | 0.21% | - | 22.62% | - | 1,031.10 | - | 41.05 | - | 70.00% | |
1,537.00 | -2.84% | 7,745 | ₹ 18,066.67 | 94.10 | 35.55 | 1,747.55 | 1,014.65 | 9.68% | 2.40% | 41.78% | 41.78% | 41.78% | 11.75 | - | - | 44.01% | - | 1,476.39 | - | 57.10 | - | - | |
121.15 | -1.98% | 1,57,980 | ₹ 17,519.62 | -237.69 | 41.51 | 201.00 | 116.70 | -10.66% | -17.11% | -27.48% | -27.48% | -27.48% | 7.97 | - | - | 2.04% | - | 127.73 | - | 41.06 | - | - | |
36.06 | -1.80% | 18,74,940 | ₹ 16,793.14 | 102.00 | -13.33 | 45.21 | 35.06 | -11.31% | -11.31% | -11.31% | -11.31% | -11.31% | 3.02 | - | - | 17.59% | - | - | - | 31.44 | - | - | |
188.35 | -1.80% | 3,42,692 | ₹ 16,760.87 | 35.78 | 113.79 | 194.00 | 89.20 | 8.06% | 24.36% | 93.44% | 93.44% | 93.44% | 3.43 | 0.21% | - | 16.84% | - | 171.25 | - | 61.92 | 60.00% | - | |
119.65 | 0.89% | 3,04,806 | ₹ 16,312.66 | -14.14 | 245.21 | 162.20 | 106.65 | 0.80% | -2.37% | -18.08% | -18.08% | -18.08% | 2.66 | - | - | 4.90% | - | 118.01 | - | 51.80 | - | - | |
1,215.05 | 1.32% | 1,560 | ₹ 15,999.72 | 39.22 | 0.67 | 1,443.00 | 1,009.00 | 6.14% | -4.89% | 13.01% | 13.01% | 13.01% | 13.33 | 0.70% | - | 42.28% | - | 1,172.93 | - | 66.19 | - | - | |
448.00 | -0.99% | 8,116 | ₹ 14,961.31 | 43.34 | 0.67 | 475.00 | 381.05 | 4.58% | 3.86% | 2.86% | 2.86% | 2.86% | 2.46 | - | - | 7.24% | - | 421.55 | - | 60.15 | 60.00% | - | |
458.80 | 0.22% | 4,351 | ₹ 14,519.64 | 90.30 | -69.06 | 567.80 | 327.40 | -9.22% | -8.11% | 12.67% | 14.26% | 14.26% | 7.51 | - | - | 8.41% | - | 482.87 | 453.80 | 46.06 | 65.00% | - | |
208.80 | 1.26% | 1,52,727 | ₹ 14,456.16 | 15.92 | 4.23 | 248.35 | 171.50 | 0.31% | -4.68% | -4.68% | -4.68% | -4.68% | 4.60 | - | - | 23.04% | - | 198.91 | - | 56.53 | - | - | |
147.50 | -0.84% | 10,52,099 | ₹ 14,012.50 | 114.42 | 9.11 | 157.15 | 105.95 | 0.10% | 21.95% | 32.29% | 32.29% | 32.29% | 9.00 | 0.27% | - | 0.31% | - | 139.97 | - | 56.02 | - | - | |
397.05 | 1.19% | 1,00,422 | ₹ 13,701.63 | 40.54 | -13.33 | 461.00 | 247.80 | 0.30% | -8.76% | 24.76% | 24.76% | 24.76% | 9.91 | - | - | 52.13% | - | 398.90 | - | 49.39 | - | - | |
776.20 | -0.56% | 11,734 | ₹ 12,787.92 | 62.34 | 28.09 | 887.95 | 571.00 | 19.50% | 24.91% | 23.71% | 23.71% | 23.71% | 11.21 | - | - | 34.76% | - | 678.95 | - | 69.71 | - | - | |
1,607.35 | 0.32% | 3,041 | ₹ 9,830.57 | 57.18 | 2.17 | 1,658.70 | 1,336.95 | 12.75% | 11.84% | 11.84% | 11.84% | 11.84% | 14.85 | 0.46% | - | 30.30% | - | - | - | 65.21 | - | - | |
142.90 | -1.58% | 50,167 | ₹ 9,583.81 | -193.60 | 26.45 | 165.40 | 131.35 | 1.31% | -5.68% | -5.68% | -5.68% | -5.68% | 5.71 | - | - | -2.97% | - | - | - | 54.44 | - | - | |
235.00 | -0.63% | 91,744 | ₹ 8,514.76 | 19.01 | 4.23 | 407.85 | 188.55 | 3.84% | -25.68% | -34.07% | -34.07% | -34.07% | 2.90 | - | - | 25.93% | - | 227.94 | - | 58.93 | - | - | |
385.40 | -5.86% | 2,16,735 | ₹ 8,337.70 | -128.74 | 41.51 | 428.20 | 317.00 | 10.75% | 10.75% | 10.75% | 10.75% | 10.75% | 16.70 | - | - | -8.21% | - | - | - | 59.97 | - | - | |
575.55 | -1.11% | 1,943 | ₹ 7,713.71 | 170.18 | 41.51 | 662.15 | 554.60 | -6.27% | -7.45% | -7.88% | -7.88% | -7.88% | 38.86 | - | - | 11.08% | - | 592.75 | - | 43.67 | - | - | |
557.50 | -1.69% | 8,748 | ₹ 7,637.15 | 30.39 | 34.41 | 755.00 | 545.70 | -7.71% | -18.76% | -21.85% | -21.85% | -21.85% | 3.16 | 7.72% | - | 13.79% | - | 600.41 | - | 38.56 | - | - | |
665.00 | 0.62% | 4,690 | ₹ 7,511.08 | 43.91 | 2.17 | 795.80 | 524.95 | 21.77% | -14.05% | -14.05% | -14.05% | -14.05% | 9.10 | - | - | 34.79% | - | 620.81 | - | 63.11 | - | - | |
172.45 | 1.29% | 4,12,046 | ₹ 7,448.65 | 27.28 | -69.06 | 174.70 | 138.15 | 16.36% | 16.40% | 16.40% | 16.40% | 16.40% | 3.75 | - | - | 21.95% | - | - | - | 69.38 | - | - | |
151.60 | 3.20% | 1,03,819 | ₹ 7,409.05 | 31.46 | 26.21 | 218.50 | 137.80 | -3.50% | -11.96% | -22.99% | -22.99% | -22.99% | 4.11 | - | - | 31.18% | - | 154.14 | - | 50.26 | - | - | |
350.85 | 5.47% | 93,783 | ₹ 7,224.49 | -73.11 | 26.21 | 458.10 | 318.00 | 0.19% | -4.84% | -19.12% | -19.12% | -19.12% | 1.72 | - | - | 2.05% | - | 341.95 | - | 57.43 | - | - | |
124.50 | 4.62% | 12,79,003 | ₹ 7,197.76 | 1,081.82 | 378.79 | 122.70 | 98.60 | 13.28% | 13.28% | 13.28% | 13.28% | 13.28% | 3.94 | - | - | 2.67% | - | - | - | - | - | - | |
214.80 | -0.56% | 2,10,618 | ₹ 7,020.28 | 171.43 | 44.65 | 218.20 | 164.00 | 24.38% | 11.70% | 11.70% | 11.70% | 11.70% | 7.02 | - | - | -0.74% | - | - | - | 79.49 | - | - | |
897.15 | 0.71% | 4,387 | ₹ 6,898.78 | 47.48 | 4.23 | 1,093.50 | 712.00 | 9.28% | -7.80% | 8.96% | 8.96% | 8.96% | 8.76 | - | - | 43.12% | - | 851.26 | - | 62.13 | - | - | |
451.20 | 0.65% | 27,656 | ₹ 6,827.58 | -98.10 | 86.31 | 793.00 | 415.00 | -7.63% | -25.29% | -17.36% | -17.36% | -17.36% | 4.08 | - | - | -0.78% | - | 480.58 | - | 47.54 | - | - | |
399.35 | 0.76% | 31,886 | ₹ 6,506.14 | 39.95 | 41.51 | 399.55 | 221.55 | 6.95% | 47.50% | 56.85% | 56.85% | 56.85% | 9.05 | - | - | 51.19% | - | 351.03 | - | 66.39 | - | - | |
211.00 | -1.36% | 6,786 | ₹ 6,465.27 | - | 4.23 | 231.00 | 192.10 | -1.36% | 1.27% | 1.27% | 1.27% | 1.27% | - | - | - | 17.62% | - | 209.07 | - | 51.72 | - | - | |
799.65 | 4.59% | 73,099 | ₹ 6,192.82 | 35.78 | 4.23 | 1,081.45 | 270.60 | 8.57% | -10.98% | 106.60% | 106.60% | 106.60% | 12.60 | 0.13% | - | 18.31% | - | 720.89 | 742.27 | 60.40 | 0.00% | - | |
578.15 | -0.58% | 19,289 | ₹ 5,801.20 | 81.79 | -69.06 | 603.25 | 445.00 | 17.02% | 22.59% | 22.59% | 22.59% | 22.59% | 5.38 | - | - | 15.19% | - | - | - | 71.95 | - | - | |
496.80 | -3.21% | 5,225 | ₹ 5,683.73 | 23.39 | 26.45 | 756.75 | 474.00 | -14.72% | -11.93% | -16.59% | -16.59% | -16.59% | 4.69 | - | - | 29.95% | - | 564.63 | 631.69 | 38.15 | 65.00% | - | |
1,456.75 | -3.67% | 9,797 | ₹ 5,267.73 | 41.03 | 41.51 | 1,856.60 | 1,048.65 | -7.06% | 31.53% | 27.66% | 27.66% | 27.66% | 6.75 | - | - | 23.76% | - | 1,512.52 | - | 48.48 | - | - | |
414.20 | 0.50% | 4,524 | ₹ 5,264.69 | 13.36 | 4.23 | 580.00 | 345.15 | 2.23% | -11.83% | -5.80% | -5.80% | -5.80% | 4.35 | - | - | 60.45% | - | 390.45 | - | 55.03 | - | - | |
460.75 | -2.71% | 3,584 | ₹ 5,264.27 | -375.87 | 41.51 | 618.30 | 393.35 | -0.35% | -21.46% | 3.52% | 3.52% | 3.52% | 10.62 | - | - | 7.48% | - | 463.70 | - | 49.19 | - | - | |
260.00 | -1.76% | 43,361 | ₹ 5,184.85 | 25.84 | 9.11 | 353.55 | 244.35 | -12.30% | -17.30% | -13.41% | -13.41% | -13.41% | 7.77 | 0.94% | - | 43.86% | - | 282.75 | - | 43.45 | - | - | |
563.00 | -2.54% | 9,457 | ₹ 4,465.25 | 242.73 | 53.59 | 799.00 | 560.00 | -10.71% | -7.23% | -7.23% | -7.23% | -7.23% | 4.87 | - | - | 3.14% | - | 649.71 | - | 30.88 | - | - | |
265.30 | -2.50% | 2,277 | ₹ 4,292.71 | 19.90 | 53.59 | 436.95 | 231.50 | -3.40% | -25.18% | -35.53% | -35.53% | -35.53% | 3.44 | 0.39% | - | 40.99% | - | 272.95 | - | 50.97 | - | - | |
241.50 | 1.19% | 4,813 | ₹ 4,225.83 | 21.46 | 41.51 | 387.50 | 217.95 | -9.16% | -19.89% | -21.45% | -21.45% | -21.45% | 6.96 | - | - | 39.69% | - | 262.98 | - | 44.22 | - | - | |
351.00 | -1.71% | 52,060 | ₹ 4,000.61 | 11.71 | 50.91 | 889.45 | 353.75 | -25.89% | -46.10% | -43.83% | -43.83% | -43.83% | 2.72 | - | - | 81.49% | - | 466.96 | - | 25.09 | - | - | |
184.65 | -0.89% | 23,338 | ₹ 3,985.69 | 15.60 | 8.47 | 232.20 | 160.15 | -2.12% | -12.57% | -15.10% | -15.10% | -15.10% | 1.91 | - | - | 38.43% | - | 187.02 | - | 52.01 | - | - | |
183.30 | 1.05% | 1,148 | ₹ 3,849.51 | -33.41 | 41.51 | 243.80 | 165.20 | -6.02% | -15.53% | -15.88% | -15.88% | -15.88% | 6.98 | - | - | 4.46% | - | 194.21 | - | 47.52 | - | - | |
329.75 | -1.24% | 3,243 | ₹ 3,759.53 | 36.37 | 35.55 | 401.45 | 239.00 | 14.74% | -2.87% | -1.12% | -1.12% | -1.12% | 5.70 | - | - | 38.19% | - | 292.71 | - | 66.23 | - | - | |
436.55 | 0.09% | 3,578 | ₹ 3,743.53 | 25.33 | 41.51 | 550.00 | 310.70 | 15.46% | -5.47% | -17.76% | -17.76% | -17.76% | 2.67 | - | - | 15.29% | - | 394.50 | - | 63.70 | - | - | |
573.05 | -0.62% | 22,920 | ₹ 3,594.47 | 34.08 | 9.11 | 795.10 | 432.00 | -8.66% | -7.18% | 28.59% | 28.59% | 28.59% | 2.78 | 1.72% | - | 26.70% | - | 609.98 | - | 42.01 | - | - | |
248.35 | -3.89% | 8,146 | ₹ 3,500.14 | 36.50 | 51.44 | 637.00 | 245.00 | -17.27% | -44.27% | -54.11% | -54.11% | -54.11% | 4.05 | - | - | 17.90% | - | 305.55 | - | 35.69 | - | - | |
98.28 | 2.79% | 1,09,557 | ₹ 2,896.03 | 26.71 | 20.14 | 149.24 | 80.70 | 6.79% | -10.74% | 0.72% | 0.72% | 0.72% | 2.88 | - | - | 14.59% | - | 93.08 | - | 59.64 | - | - | |
368.00 | -2.08% | 13,994 | ₹ 2,493.41 | 27.07 | -13.33 | 402.30 | 330.15 | 4.41% | 3.79% | 3.79% | 3.79% | 3.79% | 3.30 | - | - | 27.88% | - | - | - | 54.43 | - | - | |
234.00 | 0.15% | 10,291 | ₹ 2,391.48 | 34.11 | 41.51 | 389.95 | 210.25 | -18.89% | -29.97% | -5.74% | -5.74% | -5.74% | 8.94 | - | - | 41.89% | - | 280.97 | - | 41.33 | - | - | |
62.24 | 1.57% | 24,891 | ₹ 2,364.14 | 44.41 | 0.67 | 91.74 | 58.10 | -6.46% | -22.75% | -27.12% | -27.12% | -27.12% | 2.56 | - | - | 15.70% | - | 66.66 | - | 45.95 | - | - | |
116.20 | 2.24% | 97,814 | ₹ 2,356.74 | 17.30 | 8.47 | 239.45 | 96.20 | -19.28% | -37.96% | -30.73% | -30.73% | -30.73% | 3.25 | - | - | 91.19% | - | 136.88 | - | 43.89 | - | - | |
239.00 | 0.87% | 2,74,296 | ₹ 2,304.73 | 28.76 | 86.31 | 250.20 | 177.40 | 3.53% | 9.11% | 29.29% | 29.29% | 29.29% | 3.74 | - | - | 43.80% | - | 223.83 | - | 59.45 | - | - | |
87.05 | 0.89% | 1,86,560 | ₹ 2,245.12 | 25.83 | 18.67 | 118.40 | 84.25 | -9.32% | -15.11% | -8.98% | -8.98% | -8.98% | 1.92 | - | - | 32.48% | - | 92.43 | - | 43.29 | - | - | |
520.25 | -0.02% | 1,059 | ₹ 2,047.36 | 25.13 | 24.16 | 599.80 | 472.55 | -1.27% | -5.39% | -7.17% | -7.17% | -7.17% | 4.26 | 0.48% | - | 19.91% | - | 524.07 | - | 53.47 | - | - | |
173.40 | 3.65% | 46,412 | ₹ 2,012.93 | - | 51.44 | 424.20 | 59.91 | -19.24% | -22.24% | 83.84% | 37.63% | 37.63% | - | - | - | 16.13% | - | 176.03 | 145.84 | 53.33 | - | - | |
191.00 | -2.70% | 30,903 | ₹ 1,918.63 | 23.94 | 20.14 | 344.00 | 175.60 | -24.18% | -39.80% | -0.05% | -0.05% | -0.05% | 2.86 | - | - | 21.20% | - | 252.79 | - | 33.56 | - | - | |
333.00 | -0.03% | 16,940 | ₹ 1,903.04 | 20.22 | 8.47 | 535.85 | 291.10 | -4.53% | -23.54% | -18.61% | -18.61% | -18.61% | 3.20 | - | - | 32.94% | - | 354.00 | - | 46.77 | - | - | |
213.60 | -2.22% | 7,482 | ₹ 1,851.33 | 23.41 | 8.47 | 389.00 | 215.15 | -21.97% | -29.28% | -33.91% | -33.91% | -33.91% | 2.53 | - | - | 30.15% | - | 261.04 | - | 31.63 | - | - | |
264.30 | -0.08% | 963 | ₹ 1,731.37 | 48.44 | 24.16 | 334.80 | 217.05 | 7.26% | -5.61% | -6.69% | -6.69% | -6.69% | 2.91 | - | - | 20.98% | - | 253.76 | - | 58.70 | - | - | |
219.00 | 1.13% | 28,767 | ₹ 1,578.90 | 12.22 | 86.31 | 274.05 | 184.05 | 5.64% | -4.60% | -4.45% | -4.45% | -4.45% | 2.88 | - | - | 49.51% | - | 199.86 | - | 59.92 | - | - | |
246.65 | 0.12% | 14,523 | ₹ 1,320.56 | 14.36 | 8.92 | 338.60 | 215.60 | -2.57% | -16.97% | -12.46% | -12.46% | -12.46% | 2.67 | - | - | 25.22% | - | 260.56 | - | 49.56 | - | - | |
202.55 | -1.67% | 7,127 | ₹ 1,113.26 | 49.05 | -69.06 | 509.75 | 180.40 | -17.83% | -40.37% | -53.54% | -63.22% | -63.22% | 4.94 | - | - | 16.33% | - | 240.87 | 337.05 | 40.76 | 65.00% | - | |
93.15 | 1.99% | 2,09,057 | ₹ 1,072.01 | 22.22 | 53.59 | 142.65 | 68.04 | 10.46% | -26.04% | -26.04% | -26.04% | -26.04% | 1.85 | - | - | 15.95% | - | 84.89 | - | 67.26 | - | - | |
476.35 | -1.60% | 15,475 | ₹ 1,055.41 | 28.24 | 41.51 | 890.00 | 386.10 | 15.21% | -25.62% | -36.06% | -36.06% | -36.06% | 3.73 | 0.19% | - | 40.90% | - | 499.11 | - | 45.35 | - | - | |
197.00 | 3.71% | 16,322 | ₹ 1,029.07 | 33.62 | 51.44 | 349.00 | 133.10 | 22.89% | -2.67% | -38.26% | -38.26% | -38.26% | 2.18 | - | - | 23.34% | - | 161.93 | - | 65.70 | - | - | |
174.55 | 0.93% | 36,079 | ₹ 1,027.66 | 41.88 | 4.23 | 253.00 | 107.10 | 3.59% | 10.09% | 38.26% | 38.26% | 38.26% | 3.86 | - | - | 40.83% | - | 168.47 | - | 63.23 | 36.00% | - | |
47.44 | -1.92% | 37,826 | ₹ 1,009.01 | 20.24 | 4.23 | 58.48 | 43.70 | -2.57% | -10.73% | -10.73% | -10.73% | -10.73% | 2.22 | - | - | 35.17% | - | - | - | 46.63 | - | - | |
113.90 | 1.06% | 31,291 | ₹ 898.02 | 93.92 | -69.06 | 123.25 | 98.25 | 11.18% | 8.84% | 8.84% | 8.84% | 8.84% | 3.21 | - | - | 39.85% | - | - | - | 67.40 | - | - | |
138.55 | 3.74% | 61,897 | ₹ 890.68 | 33.47 | 20.29 | 154.00 | 100.10 | 9.31% | 2.86% | 28.01% | 28.01% | 28.01% | 2.92 | - | - | 34.87% | - | 125.17 | - | 61.21 | - | - | |
140.95 | -0.35% | 2,523 | ₹ 844.42 | 21.53 | 20.14 | 230.80 | 113.95 | -9.27% | -18.90% | -4.08% | -4.08% | -4.08% | 2.27 | - | - | 31.44% | - | 149.51 | - | 49.27 | 60.00% | - | |
102.20 | 1.69% | 1,52,810 | ₹ 831.72 | 21.47 | 35.55 | 209.10 | 82.40 | -12.46% | -33.20% | -41.30% | -41.30% | -41.30% | 1.17 | - | - | 21.63% | - | 113.88 | - | 50.02 | - | - | |
300.10 | -0.61% | 15,008 | ₹ 801.27 | 12.19 | 26.21 | 479.10 | 248.90 | -3.02% | -25.85% | -3.95% | -13.38% | -13.38% | 1.85 | - | - | 17.56% | - | 308.76 | 345.08 | 55.41 | 50.00% | - | |
192.15 | -2.04% | 5,258 | ₹ 776.53 | 21.18 | 34.41 | 309.65 | 188.05 | -5.69% | -32.01% | -34.63% | -34.63% | -34.63% | 2.15 | 3.78% | - | 22.06% | - | 215.12 | - | 39.60 | - | - | |
270.65 | -1.80% | 3,296 | ₹ 747.81 | 17.17 | 4.23 | 573.95 | 244.05 | -22.76% | -41.37% | -49.31% | -49.31% | -49.31% | 1.35 | - | - | 44.83% | - | 333.61 | - | 34.89 | - | - | |
166.00 | 2.85% | 5,952 | ₹ 737.88 | 22.86 | 35.55 | 262.40 | 137.65 | -13.04% | -30.16% | -8.94% | -8.94% | -8.94% | 1.69 | - | - | 31.09% | - | 193.18 | - | 45.00 | - | - | |
202.45 | -2.34% | 3,774 | ₹ 676.19 | 19.11 | 35.55 | 305.00 | 170.10 | 9.20% | -9.01% | -30.13% | -30.13% | -30.13% | 1.88 | - | - | 32.37% | - | 200.92 | - | 51.77 | - | - | |
122.05 | -0.97% | 5,549 | ₹ 648.71 | 18.90 | 51.44 | 172.00 | 86.98 | -14.86% | -16.40% | 33.16% | 33.16% | 33.16% | 3.06 | - | - | 25.24% | - | 136.50 | - | 38.08 | - | - | |
60.50 | -0.51% | 41,703 | ₹ 621.48 | 12.44 | 41.51 | 145.70 | 57.50 | -10.85% | -30.36% | -54.04% | -54.04% | -54.04% | 1.36 | - | - | 17.65% | - | 67.55 | - | 39.78 | - | - | |
108.14 | -0.17% | 14,001 | ₹ 565.22 | 12.93 | 9.11 | 180.75 | 85.01 | -8.01% | -25.88% | -19.30% | -19.30% | -19.30% | 1.30 | - | - | 11.60% | - | 114.52 | - | 54.29 | - | - | |
57.40 | -1.31% | 9,801 | ₹ 497.74 | 13.40 | 35.55 | 80.00 | 49.50 | 5.96% | -13.28% | -24.47% | -24.47% | -24.47% | 1.17 | 1.88% | - | 33.30% | - | 57.27 | - | 50.39 | - | - | |
53.40 | -0.63% | 8,903 | ₹ 493.43 | 10.10 | 41.51 | 93.00 | 48.71 | -4.15% | -25.56% | -36.31% | -36.31% | -36.31% | 1.39 | - | - | 75.41% | - | 56.42 | - | 48.26 | - | - | |
70.13 | -5.64% | 8,622 | ₹ 443.39 | 12.37 | 20.29 | 121.90 | 62.05 | -7.38% | -29.55% | -36.71% | -36.71% | -36.71% | 1.07 | - | - | 18.26% | - | 76.84 | - | 42.72 | - | - | |
56.99 | 0.30% | 14,928 | ₹ 408.74 | 11.62 | 26.21 | 134.89 | 49.45 | -2.46% | -18.55% | -53.61% | -53.61% | -53.61% | 1.94 | - | - | 28.71% | - | 56.80 | - | 58.67 | - | - | |
90.00 | -1.38% | 4,027 | ₹ 303.08 | 19.09 | 41.51 | 107.44 | 82.50 | -0.04% | -0.03% | 3.93% | 3.93% | 3.93% | 1.64 | - | - | 16.54% | - | 92.41 | - | 43.65 | - | - | |
51.30 | -2.27% | 4,795 | ₹ 254.61 | 17.67 | 20.14 | 105.00 | 44.53 | 5.25% | -22.61% | -48.57% | -48.57% | -48.57% | 1.18 | - | - | 19.44% | - | 51.32 | - | 52.18 | - | - |
Showing 99 of 99 results
Please Note:
- PE Ratio: Share Price/Earning Per Share
- PB Ratio: Market Cap/Book Value
- ROE: Net Income/Shareholder's Equity
- ROCE: Earning Before Interest & Tax (EBIT)/Capital Employed
- EPS: (Net Income-Preferred Dividend)/Weighted Average Number of Shares Outstanding
- 50 DMA: Simple Moving Average of the past 50 days closing prices for a stock.
- 200 DMA: Simple Moving Average of the past 200 days closing prices for a stock.
- RSI: Relative Strength Index (14) is a momentum indicator to measure price changes to analyse overbought/oversold conditions.
- MTF: % Amount Funded by Dhan.
- Margin Pledge: % Collateral Benefit for Additional Margin.
*The scrips mentioned above are just for research purpose and not recommendations. Please do your own due diligence before investing.
Frequently Asked Questions
The BSE IPO Index tracks the performance of companies that have recently gone public on the Bombay Stock Exchange. It includes newly listed companies and measures their market performance, offering insights into how new entrants are faring in the stock market.
Stocks are selected for the BSE IPO Index based on their listing on the Bombay Stock Exchange. Companies that have recently completed their Initial Public Offerings (IPOs) and meet certain market capitalization and liquidity criteria are included in the index.
The BSE IPO Index is calculated using the free-float market capitalization method. This means only the shares available for trading are considered, excluding those held by promoters. The total free-float market value of the companies is divided by a base value and multiplied by a base index value to arrive at the index level.
Tracking the BSE IPO Index can help investors understand the performance of new market entrants. It provides a benchmark to assess how newly listed companies are performing compared to the broader market, aiding in making informed investment decisions.
The performance of the BSE IPO Index is influenced by factors such as market sentiment, the financial health of the listed companies, economic indicators, and regulatory changes. Market volatility and global economic events can also significantly impact the index.
Explore | Sitemap
*All securities mentioned on this website are exemplary and not recommendatory.
*Current prices on the website are delayed by 15 mins, login to check live prices.
We are bullish on India, we are bullish on India's prospects to be one of the largest economies in the world. We believe that the stock market provides a unique opportunity for all of India's traders and investors to participate in the growth story of the country.
Yet, most investing & trading platforms in India have remained more or less the same over the past decade. Times have changed and retail traders and investors have become smarter about managing their trades and money. Modern traders & investors require an online trading platform that helps them keep up with the technological advancements of our time.
That's why we're building Dhan - to help you trade, to help you invest, and to help you participate in India's growth stock via the stock market with awesome features and an incredible experience.
©2021-2026 Raise Securities Private Limited (formerly Moneylicious Securities Private Limited). All rights reserved. CIN: U74999MH2012PTC433549 Raise Securities is part of Raise Financial Services.
Exchange Membership No. : NSE: 90133 | BSE: 6593 | MCX: 56320
Registered & Corporate Office: Unit No. 2201, 22nd Floor, Gold Medal Avenue, S.V. Road, Beside Patel Petrol Pump, Piramal Nagar, Goregaon West, Mumbai – 400104, Customer Care: 9987761000.
For any query / feedback / clarifications, email at help@dhan.co.
In case of grievances for any of the services rendered by Raise Securities Private Limited, please write to grievance@dhan.co (for NSE, BSE and MCX) or grievancedp@dhan.co (for Depository Participant). Please ensure that you carefully read the Risk Disclosure Document as prescribed by SEBI, our Terms of Use and Privacy Policy. Compliance Officer: Mr. Manish Garg and Mobile: 8655740961 Email: complianceofficer@dhan.co To lodge your complaints using SEBI SCORES, click here.
Disclaimer: All communications with the client via chat, phone, or email are for support purposes only. Any commitments or statements made by the agent (human or virtual) shall not be binding on the company.
DHAN is a brand owned by Raise Securities Private Limited. All DHAN clients are registered under Raise Securities Private Limited. Clients are advised to refer to our company as Raise Securities Private Limited when communicating with regulatory authorities.
Procedure to file a complaint on SEBI SCORES: Register on SCORES portal. Mandatory details for filing complaints on SCORES: Name, PAN, Address, Mobile Number, E-mail ID. Benefits: Effective Communication, Speedy redressal of the grievances. You may refer the website https://scores.sebi.gov.in/ for more information. You may also download the SEBI Scores app to log a complaint Android: https://play.google.com store apps sebiscores iOS: https://apps.apple.com app sebiscores.
Disclaimer: Investment in the securities market are subject to market risks, read all the related documents carefully before investing. Brokerage will not exceed the SEBI prescribed limit
Attention investors:
- Stock brokers can accept securities as margins from clients only by way of pledge in the depository system w.e.f September 01, 2020.
- Update your e-mail and phone number with your stock broker / depository participant and receive OTP directly from depository on your e-mail and/or mobile number to create pledge.
- Check your securities / MF / bonds in the consolidated account statement issued by NSDL/CDSL every month.
Note: As a policy we do not give stock tips or recommendations and have not authorized anyone to give this on behalf of us. If you know anyone claiming to be a part of Dhan / / Raise or our associate companies or partners and offering such services, please report us on help@dhan.co. Important Information for Investors: To prevent unauthorized transactions in your trading / demat account, do not share your account details, credentials or any personal details with anyone. Keep your mobile number updated with your Stock Broker, Depository Participant and ensure that the same is registered with Stock Exchanges, Depository and KRAs. You will receive alerts and information on your registered mobile number / email for debit and other important transactions in your demat account directly from CDSL / Exchange on the same day. KYC is one time exercise while dealing in securities markets - once KYC is done through a SEBI registered intermediary (Stock Broker, DP, Mutual Fund, etc.), you need not undergo the same process again when you approach another intermediary. No need to issue cheques by investors while subscribing to IPO. Just write the bank account number and sign in the application form to authorise your bank to make payment in case of allotment. No worries for refund as the money remains in investor's account. This is issued in the interest of investors.
Investors should be cautious on unsolicited emails and SMS advising to buy, sell or hold securities and trade only on the basis of informed decision. Investors are advised to invest after conducting appropriate analysis of respective companies and not to blindly follow unfounded rumours, tips etc. Further, you are also requested to share your knowledge or evidence of systemic wrongdoing, potential frauds or unethical behaviour through the anonymous portal facility provided on BSE & NSE website. Issued in the interest of the investors.
Raise Securities Private Limited also known as Dhan is only an order collection platform that collects orders on behalf of clients and places them on BSE StarMF for execution. Client expressly agrees that Dhan is not liable or responsible and does not represent or warrant any damages regarding non- execution of orders or any incorrect execution of orders with regard to the funds chosen by the client or due to, but not being limited to, any link/system failure, delay in transfer of the funds on account of any unforeseen circumstances/issues in the banking system/payment aggregators or any other problems that may result in a delay in crediting the funds into the BSE Star MF's bank account. Raise Securities Private Limited (Dhan) does not engage in proprietary trading on its own account.
Mutual fund investments are subject to market risks, read all scheme related documents carefully before investing. Dhan is not a distributor or agent of any mutual fund. Mutual Funds are not exchange-traded products. Any related disputes will not have access to the Exchange-investor redressal forum or arbitration mechanism. For other disclaimers please refer https://dhan.co/advertisement-disclaimer/
Download client registration documents (Rights & Obligations, Risk Disclosure Document, Do's & Don'ts) in vernacular language: BSE | NSE | MCX
Kindly, read the Advisory Guidelines of BSE | NSE | MCX for investors as prescribed by the exchange with reference to their circular dated 27th August, 2021 regarding investor awareness and safeguarding client's assets
Important Links: SEBI | BSE | NSE | MCX | CDSL | SCORES | ODR Portal | Investor Charter for Stock Brokers | Investor Charter for DP | Investor Charter for Research Analyst | UCC Advisory | e-Voting for Shareholders | NCL Client Collateral details |
MCXCCL Client Collateral details
Important Information: Terms of Usage | Disclaimers | Privacy Policy | Grievances | Grievances RA | Risk Management Policy | Risk Disclosure | Advertisement Disclaimer | Referral Terms & Conditions | Saarthi 2.0 Mobile App for Investors


















































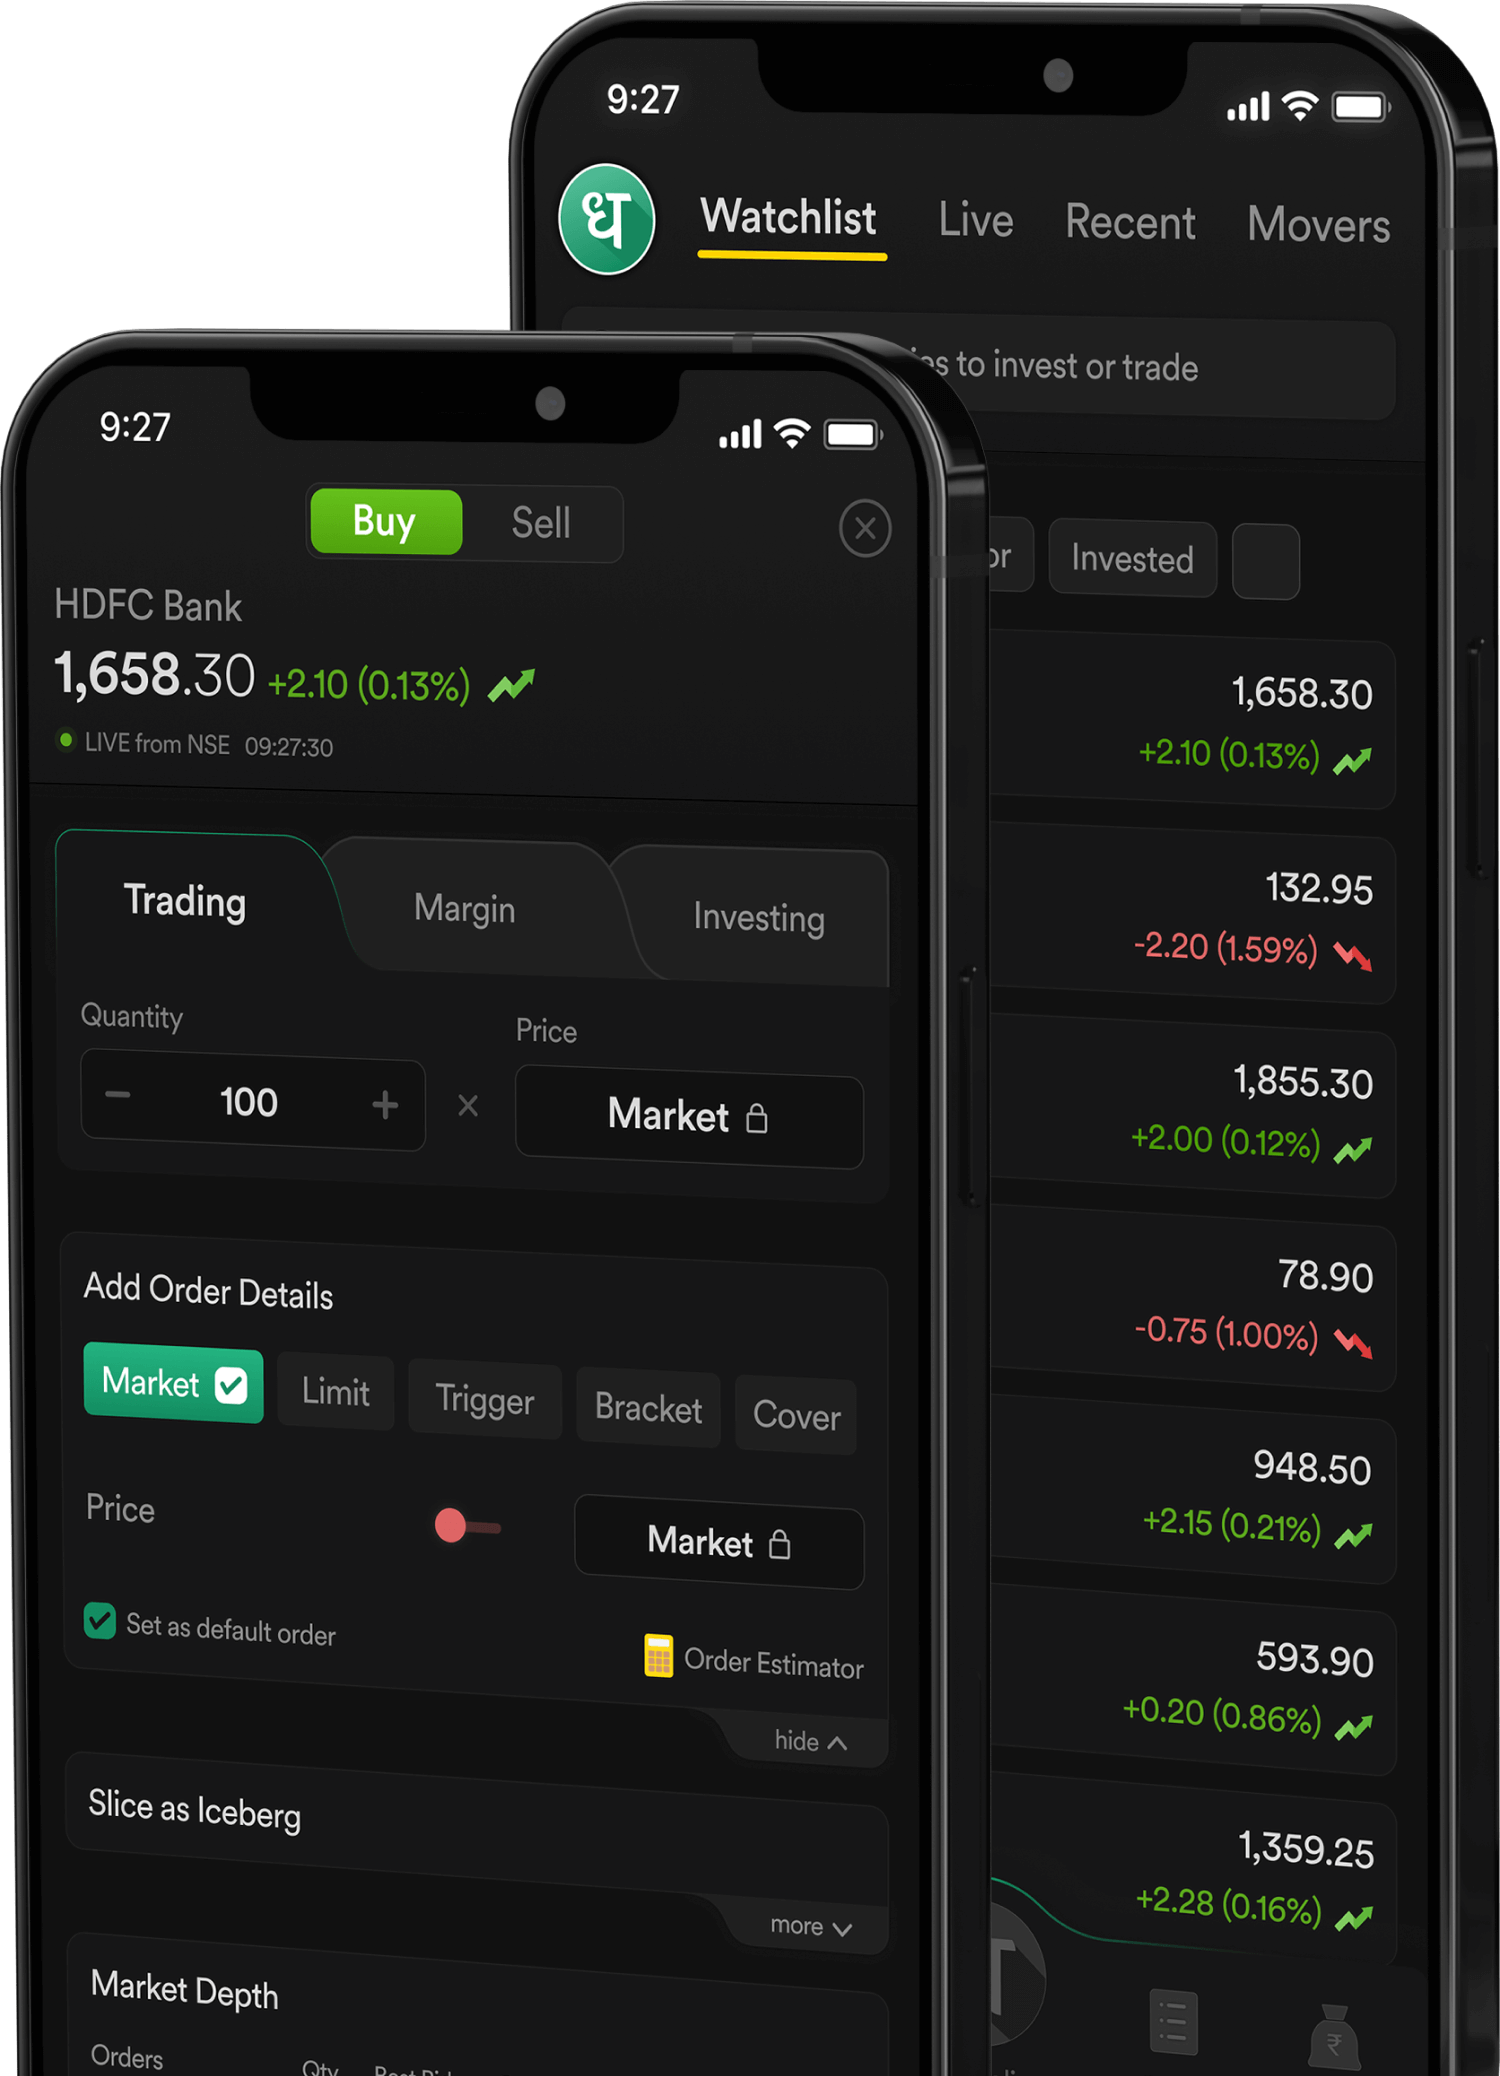
 Dhan App
 Chrome


