What is XIRR?
XIRR, or Extended Internal Rate of Return, is a financial metric that is used to calculate the annualised rate of return of an investment that involves multiple cash flows at irregular intervals. Unlike traditional methods, which assume consistent investments, XIRR takes into account the exact timing and quantity of each cash flow (whether an investment or withdrawal). It helps in assessing the performance of Systematic Investment Plans (SIPs) and other investments where investments and withdrawals are not uniform.
This makes it a highly accurate tool to evaluate investments where contributions may not be of the same amount and frequency. It offers a single rate of return that, when applied to all transactions, gives the current value of the investment, which is a realistic measure of the investment performance.
For investors, understanding XIRR is important to compare various investment options and make informed decisions while investing in mutual funds or directly investing in stocks through SIPs.
Also it is advised to estimate your monthly SIP's according to your goals using an Online SIP Calculator.
How Does the XIRR Calculator Work?
An XIRR calculator simplifies the complex process of finding the Extended Internal Rate of Return for investments with irregular cash flows. Instead of having to solve iterative calculations manually, which can be time-consuming and prone to errors, the online XIRR calculator automates this process.
Investors enter the dates of the cash flows (both investments and withdrawals), as well as their amounts. Investments are entered as negative values (cash outflows), and withdrawals or current valuations are entered as positive values (cash inflows).
The calculator then makes use of an underlying formula that seeks the discount rate at which the Net Present Value (NPV) of all these cash flows are zero. This discount rate is the XIRR and is expressed as an annualised percentage. The timing of each cash flow is critical, as XIRR considers the exact dates in order to give a true picture of the time value of money rather than simpler return calculations.
By instantaneously calculating this rate, the online XIRR calculator gives investors a comprehensive view of their investment performance and helps them compare different opportunities effectively.
XIRR vs IRR vs CAGR: What's the Difference?
XIRR, IRR and CAGR are all metrics used to assess investment returns, but they differ in their application and the type of cash flows they take into consideration. Understanding the differences between XIRR, IRR and CAGR is crucial to accurately evaluate investment returns.
Features of the Online XIRR Calculator
For Indian investors, there are several features that are accessible through the online XIRR calculator. Here's what it offers:
- Precise return calculations: It calculates the exact return on investment by considering the time and amount of each investment or cash inflow.
- Handles irregular cash flows: It stands out in cases of investments whose contributions or withdrawals are irregular.
- Versatility about investment type: This method is not just restricted to irregular SIPs; you may use it for mutual funds, stocks, bonds, etc.
- Annualised return for easy comparison: By using the XIRR calculator, you can easily compare the returns on your various investments.
- User-friendly interface: The online XIRR calculator tool has a user-friendly interface, which means you can use it without the need for financial knowledge.
- Comparison tool: Investors can use the calculated XIRR to compare the performance of multiple investment options to determine which ones are generating better returns.
- Supports financial planning: By offering a clear picture of investment growth, XIRR can help investors set financial goals that are realistic and track progress towards those goals.
How to Use the XIRR Calculator?
Using an online XIRR calculator is a simple process. It helps investors calculate the actual annualised return on their investments. The steps involved in the process are as follows:
Enter dates and cash flows
Start by entering the date of all financial transactions. For each date, indicate how much money you invested (cash outflow) or withdrew (cash inflow). In the XIRR calculator, the investments are entered as negative values, and the redemptions or the current portfolio value are entered as a positive value.
Submit data
Once all the relevant transaction dates and amounts are entered, click on the calculate button. The XIRR calculator will then process the data, applying the XIRR formula based on the timing and amount of the individual cash flows.
Interpret the results
These results will be shown on the calculator as a percentage, which will be the annualised rate of return for the investment. A higher XIRR means a higher performance. This percentage gives a complete understanding of how the investment has been performing, taking into account all the irregularities in making or withdrawing the investment transactions.
Use for decision-making
The XIRR calculation can be used by investors to make investment choices in the future. For example, when investors are comparing the XIRR of various investments, they can assess which investments are performing the best and adjust their strategy accordingly.
XIRR Formula Explained (With a Simple Example)
The XIRR formula assists in determining the rate r that will satisfy the following equation:
NPV = Σ [CFᵢ / (1 + r)^(dᵢ/365)] = 0
Where:
- CFi = Cash Flow in transaction i (Negative for investments, positive for redemptions/current value)
- r = XIRR
- dᵢ = Number of days between the first cash flow date and transaction i
- 365 = Number of days in a year (for annualisation)
This formula cannot be solved algebraically and requires the use of iterative numerical methods. Let's understand this with the help of practical examples. Consider an investor who makes the investments on the following dates:
- 01-Jan-2025 (Investment): -₹10,000
- 01-July-2025 (Investment): -₹5,000
- 01-Jan-2026 (Investment): -₹7,000
- Redemption date/Current Value: 12-Feb-2026: +₹25,000
- Total Investment: ₹22,000
- Current Value: ₹25,000
- Absolute Gain: ₹3,000 (13.63% simple return)
However, this 13.63% return is misleading because it doesn't take into consideration the duration of the investment. The first amount of Rs. 10,000 was invested for about 12 months, while the last amount was invested for 1 month only.
Through iterative calculation, the XIRR is about 19.99%. This 19.99% XIRR is much more meaningful than the 13.63% simple return because it:
- Accounts for the time when each transaction was made
- Annualises the return so that it is easy to compare with other investments
- Gives a true picture of how the investment has performed over time
When Should You Use XIRR?
XIRR is an indispensable tool for investors who deal with investment portfolios involving multiple irregular transactions over a period of time. It gives them the most accurate picture of the true annualised return of their investments, which is often not the case with traditional CAGR or IRR.
You should use XIRR for the following purposes primarily:
- Systematic Investment Plans (SIPs): If you make regular investments of a fixed or variable amount into mutual funds or stocks at different intervals, XIRR is the best metric to calculate the overall portfolio return.
- Systematic Withdrawal Plans (SWPs): For retirees or individuals who are withdrawing their income from their investments at different times, XIRR is a suitable indicator for calculating exact returns by taking into account these periodic outflows. You can also use a SWP calculator to calculate the withdrawal amount while keeping investments intact.
- Lump sum investments with partial withdrawals: If you have made a large initial investment and then withdraw some of it at different dates, XIRR will compute the effective rate of return on the remaining capital and the period it was invested.
- Multiple lump sum investments: When you make multiple lump sum investments into the same fund or stock at different points in time, XIRR combines all these investments into one so that you can have an accurate return figure.
- Portfolio performance evaluation: For a diversified portfolio in which you may be rebalancing or adding funds or selling off assets at irregular times, XIRR gives you a holistic measure of your overall portfolio's performance.
- Comparing irregular investments: When comparing two different investment options, both of which have irregular cash flows, XIRR makes it possible to have an apples-to-apples comparison of their actual annualised returns, making it easier to identify which is a better performer.
- Long-term investment analysis: For long-term investors, XIRR takes into account every fluctuation in the market and what you do over the years, giving you a real measure of your investment's efficiency.
In essence, whenever the timing and amounts of your cash flows are not perfectly regular, XIRR is the most reliable metric to gauge your investment's real-world performance.
How to Calculate XIRR in Excel or Google Sheets
Calculating XIRR in Excel or Google Sheets is a common way among investors and is an effective method without evolving complexities. Both applications contain an inbuilt XIRR function, making this process relatively simple without having to do the calculations manually. Here's a step-by-step approach:
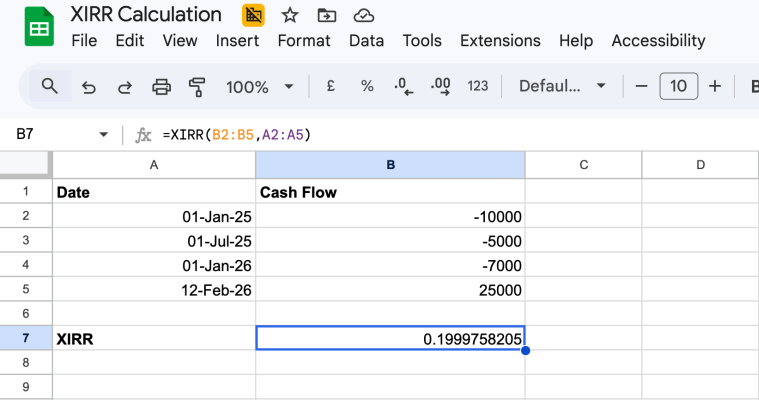
- Add the data in two columns, one for Dates and one for Cash flows.
- In the Dates column, enter all of the dates of the transactions in chronological order.
- In the Cash Flows column, put in the respective amounts.
- Remember to indicate investments as negative numbers and redemptions/current value as positive numbers.
- Include the current value of your investment as a positive cash flow on today's date (or the date you wish to calculate the XIRR up to).
Data Setup
- Apply the XIRR function: Choose an empty cell in which you want to calculate the result of the XIRR.
- The syntax is: =XIRR(values, dates)
- values: This refers to the range of cells with your cash flows (e.g. B2:B5).
- dates: This is your range of cells that have your corresponding dates (e.g. A2:A5)
- Then the formula would be =XIRR(B2:B5, A2:A5)
- After entering the details, press Enter, then the XIRR is calculated and shown as a decimal value (e.g. 0.1999) by Excel.
- Format the decimal value as a percentage by multiplying it by 100. The XIRR will be 19.99%
Common XIRR Mistakes
While XIRR is a powerful tool, there are some common mistakes to watch out for that could result in inaccurate results or misinterpretations:
Incorrect sign convention
The most common mistake is to assign the wrong positive or negative signs to the cash flows. All money that has been invested or paid out (e.g. SIP instalments, lump sum deposits) should be entered as negative numbers. All money received (i.e. withdrawals, redemptions, and current portfolio value) must be positive. Reversing these signs yields a completely incorrect XIRR.
Missing the current value
For ongoing investments, many users forget to include the current market value of their investment as a positive cash flow with today's date (or the date up to which the calculation is desired). Without this last cash flow, the calculator assumes the investment is over with zero value, resulting in a distorted, often negative, XIRR.
Incorrect dates
XIRR's accuracy depends on accurate dates. Using approximate dates or not entering the dates in chronological order can skew the result. Make sure to add each cash flow along with its exact date of the transaction.
Confusing XIRR with CAGR for irregular investments
It is a big mistake to use CAGR for investments that have multiple, irregular cash flows. CAGR can be used only for a single initial investment and a single final value, without considering all the transactions in between. XIRR is the right measure for SIPs and other dynamic investments with irregular transactions at various intervals.
Short-Term XIRR misinterpretation
Although XIRR gives an annualised rate, interpreting it over very short periods (e.g., a few months) can be misleading. Annualised returns are more meaningful and stable for longer investment horizons, because short-term fluctuations in the markets can cause significant changes in the initial XIRR calculations.
By avoiding these common pitfalls, investors can take advantage of the full power of the XIRR calculator to gain a true understanding of their investment performance.



 Nifty 50
 Sensex



 US Tech 100
 Dow Jones
 FTSE
FTSE Dax
Dax CAC
CAC Nikkei 225
 Hang Seng
 SSE Composite
 TAIEX
TAIEX KOSPI
KOSPI Gift Nifty
 Strategy Indices
 Broad Market Indices
 Sectoral Indices
 Thematic Indices