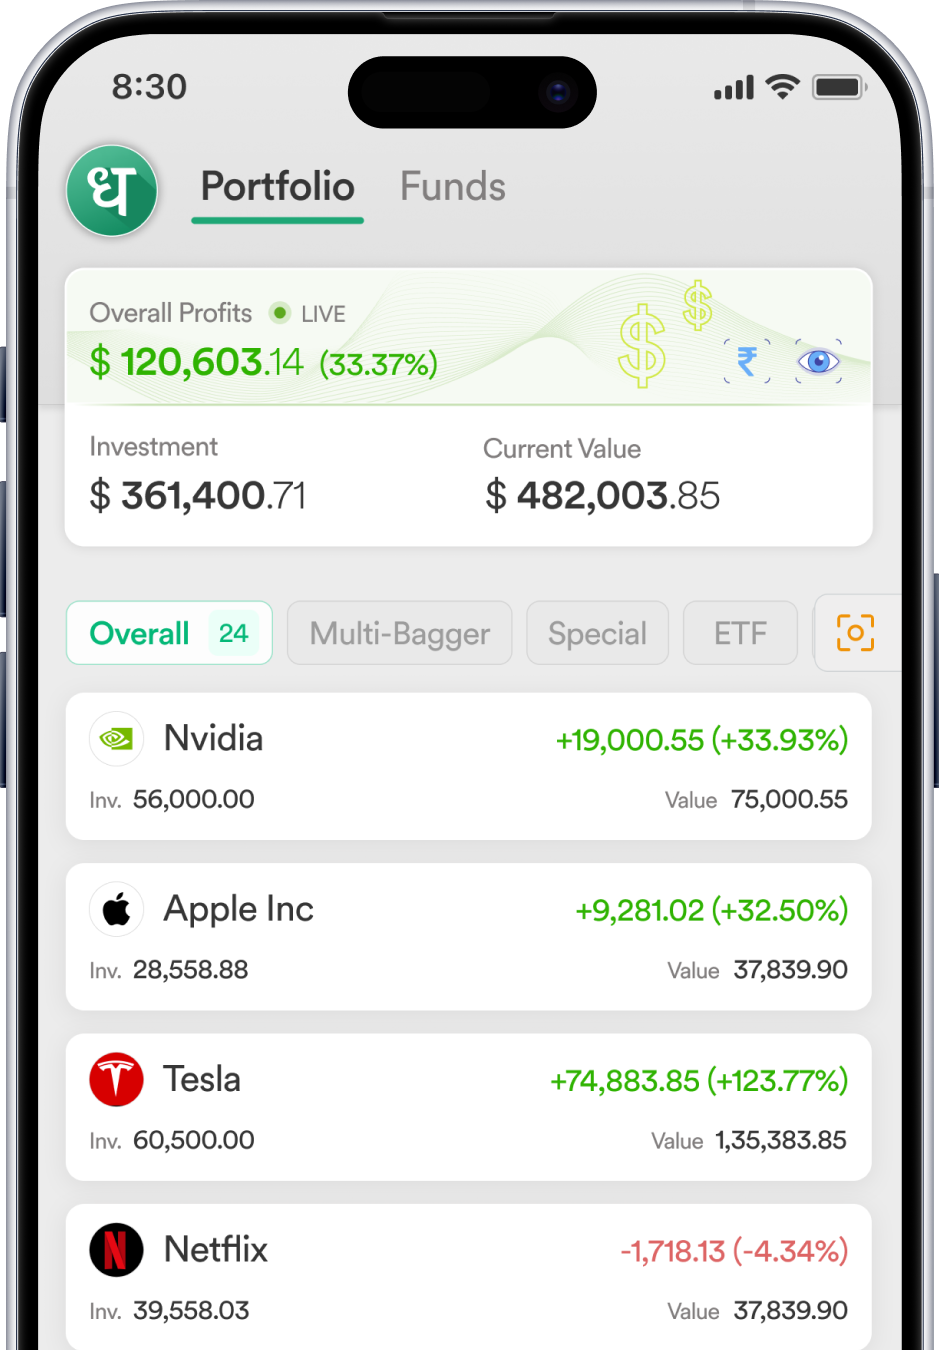
What can you see in the NASDAQ Stocks List?
The NASDAQ Stocks List on Dhan covers all the companies listed on the NASDAQ exchange. It shows live stock prices, which are free to browse without logging in. Here's what you will find on this page:
- Complete stock data: Each row shows the LTP in USD, percentage of change in stock price in a day, volume, market cap, PE ratio, industry PE, 52-week high, and returns across five windows - 1 month, 3 months, 1 year, 3 years, and 5 years along with ROE and ROCE.
- Alphabetical navigation: Jump directly to companies starting with a particular initial from A to Z. The “Others” category lists stocks with less common starting letters.
- Sortable market cap, downloadable CSV, and analytics: Investors can click on the market cap header to re-rank the list by size, which can be largest to smallest or the reverse. Export visible data for comparing offline by downloading the CSV file. There's an option to analyse stocks quickly using Fuzz AI before going through detailed stock pages.
The NASDAQ Exchange
The National Association of Securities Dealers Automated Quotations (NASDAQ) was the first electronic stock exchange in the world. Structurally, it is different from the NYSE as it doesn't have any physical trading floor.
All the trades on this exchange run through a network of market makers. These are financial firms that continuously quote both a buy and a sell price for a given stock, and are obligated to trade at those quotes. Here, the order from one buyer simply doesn't meet an order from a seller at an auction. Trades on NASDAQ route through one of these competing market makers, who supply the liquidity on both sides.
Due to this dealer-based structure, NASDAQ has been hosting technology and high-growth companies from the 1970s onward. The all-electronic system came into being when the market needed to scale trading volume fast, with technology listings rapidly increasing.
Today, companies across almost every sector are listed on NASDAQ. The exchange is the home to some of the largest technology, semiconductor, and internet-based businesses in the world. Many of these companies are at the top of this list in terms of market capitalisation.
NASDAQ Composite vs NASDAQ -100
You will come across two different NASDAQ benchmarks in financial media - NASDAQ Composite and NASDAQ -100. It's worth knowing which one you actually look at when you see a stock listed on NASDAQ.
This list on Dhan covers every company listed on NASDAQ, and is closer in nature to the Composite, not the curated slice of top 100 stocks. You will see individual weightings and rankings here, sorted by market cap. It shows you why the NASDAQ -100 looks the way it does, as the largest names on this table are exactly the companies that dominate the NASDAQ -100.
Reading the columns
On the NASDAQ stocks list, each row carries the following details.
- Name: The first column contains the name of the listed company, along with its initial and logo.
- LTP: This is the last traded price, presented in US dollars.
- Change %: It shows the percentage of movement in a stock price so far in the current session.
- Volume: Trading volume shows the number of shares traded during the session.
- Market Cap (Mn): Expressed in millions of dollars, this is the total market capitalisation of the company. Investors can sort this column by clicking on its header to arrange the largest companies on NASDAQ at the top.
- PE Ratio: PE ratio shows the price-to-earnings ratio of the company, obtained by dividing its current share price by earnings per share.
- Industry PE: This is the average PE across the industry the company operates in, calculated by taking the numbers of its peers. It helps investors determine the relative valuation of a company.
- 52W High: It shows the highest price that the stock has touched over the last 52 weeks.
- 1-Month/3-month/1-year/3-year/5-year returns: You can see the trailing returns in each column corresponding to the respective window.
- ROE: Return on Equity is the net income of the company, which is expressed as a percentage of the equity owned by shareholders. ROE shows how efficiently a company generates profit from the capital shareholders have put in.
- ROCE: Return on Capital Employed is the operating profit, which is expressed as a percentage of the total capital in use. This includes both equity and debt. It's a broader parameter to measure efficiency that also shows how the company uses borrowed capital.
How to use the table controls?
Here's how investors can use the table controls on the NASDAQ stocks list page to move through the full set of data.
- Alphabet filter: Go directly to companies starting with a specific letter without browsing the full list.
- Sorting by market cap: Investors can click on the header of the column to re-sort the list of companies on the basis of their market capitalisation.
- Download CSV: Save the data visible on this page into a spreadsheet for offline comparison later on.
- Fuzz AI: The page contains the “Analyze with Fuzz AI” option for a quick overview of each stock generated by AI before you go through the details on its individual page.
- Page numbers: Browse through the remaining pages of the listing beyond the first page.
Key terms to know
- Market maker: A market maker is a firm that continuously quotes buy and sell prices for a stock on NASDAQ. It is obligated to trade at those prices, providing the liquidity that keeps the dealer market functioning.
- Dealer market: Dealer market refers to a market structure like the NASDAQ, where trades are routed through intermediary dealers instead of matching directly between two counterparties.
- PE Ratio: PE ratio is a measure of valuation of the stock where the price of the share is compared to the earnings per share.
- NASDAQ-100: This is an index consisting of the 100 largest non-financial companies listed on NASDAQ. Growth and technology-oriented funds widely track this index.
- NASDAQ Composite: This is the other broader index that covers virtually all common stocks listed on the NASDAQ, across all sectors.
- Fractional share: A fractional share is a portion of a single share. Investors buying a part of a share can gain proportional exposure to the company, even when they do not buy a full unit.
- Listing tier: The companies listed on NASDAQ are categorised into three tiers - Global Select, Global Market, and Capital Market. This categorisation is made on the basis of financial strength and liquidity standards. Global Select carries some of the most stringent requirements.
Why browse NASDAQ stocks on Dhan?
Investors experience some practical benefits from screening NASDAQ stocks on Dhan.
- Tech and growth exposure in one table: A lot of technology and innovation-based companies are concentrated on NASDAQ. This list on Dhan works as a screening ground for this theme. Investors do not have to search for individual companies.
- Valuation along with growth: The average PE ratios on growth-oriented exchanges on NASDAQ are usually higher. With the industry PE placed just beside the own PE of each company, you can judge whether a specific stock is expensive even by growth-sector standards.
- Fractional investing: Once you shortlist a company, the GIFT City-based fractional access on Dhan lets you invest in dollars. Investors can start just from $1, which is practical considering how expensive some of the individual stocks can be.
- Refreshed and exportable: The list contains updated data on pricing, returns, and valuation. You can download the details as a CSV file, which lets you build your own screens.
Things to know before investing in NASDAQ stocks
Investors must consider the following aspects before they put their money in NASDAQ stocks.
- Growth-oriented stocks can be volatile: As the NASDAQ lists many technology stocks, the ones that are in the early stages of their business can see sharper price swings in both directions. Compared to a more diversified index, NASDAQ stocks can be more volatile.
- A high PE isn't automatically overvalued: For growth companies, the PE is often calculated on the basis of expected earnings in the future instead of current profits. That's why a PE well above the industry PE isn't automatically a red flag. However, it raises the bar for what the company needs to deliver.
- Currency movement affects your actual return: All the prices you see on this page are in USD. Your actual return depends on the currency conversion rate between the US Dollar and the Indian Rupee, and how the rates move between your entry and exit.
- Concentration risk within the exchange itself: The total market cap of NASDAQ is disproportionate, as a few companies account for a larger share of this capital. Therefore, an index or ETF that tracks the “whole” NASDAQ index may still carry significant concentration in just a few names.
- The LRS annual cap: You may invest through the GIFT City route or a direct international brokerage. In any case, remittances abroad fall under the Liberalised Remittance Scheme ceiling of USD 250,000 per financial year, as established by the RBI.
- Tax treatment: Gains on stocks listed on the NASDAQ for Indian residents are considered unlisted foreign securities for tax purposes. The tax rate based on STCG or LTCG depends on whether you have been holding the shares for more than 24 months or not.
Frequently Asked Questions
What is the NASDAQ?
NASDAQ is the world's first electronic stock exchange. It operates as a dealer market where trades are routed through the competing market makers instead of a physical trading floor. NASDAQ lists many of the world's largest technology and growth companies.
What's the difference between NASDAQ and NYSE?
NASDAQ is an all-electronic dealer market. Here, the buy and sell prices for each stock are quoted by market makers. The NYSE is a hybrid auction market that continues to use Designated Market Makers. These DMMs help in setting the opening and closing prices of stocks on the exchange. NASDAQ is also more inclined toward technology and growth companies. NYSE is composed of a broader mix of established industrial and financial companies.
What's the difference between the NASDAQ Composite and the NASDAQ-100?
The NASDAQ Composite includes all the stocks listed on the exchange across every sector. The NASDAQ-100 is a narrower index that lists just the 100 largest non-financial companies on the exchange. It is widely tracked by growth-oriented ETFs like QQQ.
Can Indian residents invest in NASDAQ-listed stocks?
Yes. Indian residents can invest in stocks listed on NASDAQ through platforms like Dhan. Dhan brings you the opportunity for fractional ownership through the GIFT City IFSC framework of India. You can also invest through the Liberalised Remittance Scheme of the RBI, which is routed to an international brokerage.
Why do some companies show a dash under PE ratio?
A dash under PE ratio means the company hasn't reported positive trailing earnings. That's why a practical price-to-earnings figure could not be calculated.
Is NASDAQ riskier to invest in than the NYSE?
NASDAQ is not inherently riskier. But it carries a heavier weight for growth and technology stocks, which makes it more volatile as an exchange. The companies listed under it are more sensitive to changes in growth expectations and interest rates.
Do I need a Dhan account to view the NASDAQ stocks list?
No, this is a free list where you can view the names of companies, LTP, change %, volume, market cap, PE ratio, and returns without requiring an account or logging in. You will need an account on Dhan only when you want to invest.

 Nifty 50
 Sensex
 Apple
Apple Microsoft
 NVIDIA
 Alphabet
 Amazon
 Meta Platforms
 Tesla
Tesla Netflix
 Walt Disney
 Eli Lilly
 UnitedHealth Group
 Visa
Visa Mastercard
 JPMorgan Chase
 Walmart
 Costco Wholesale
 Coca-Cola
 PepsiCo
 Palantir Technologies
 Broadcom
 Large Cap Funds
 Bluechip Funds
 Mid Cap Funds
 Focused Funds
 Small Cap Funds
 Sectoral Funds
 Large & Mid Cap Funds
 International Funds
 Flexi Cap Funds
 Value Funds
 Multi Cap Funds
 Contra Funds
 Dividend Yield Funds
 ELSS Funds
 Nifty 50 ETF
 Nifty Next 50 ETF
 Bank Nifty ETF
 Nifty IT ETF
 Sensex ETF
 Gold Rate in Mumbai
 Gold Rate in Delhi
 Gold Rate in Chennai
 Gold Rate in Kolkata
 Gold Rate in Bangalore
 Gold Rate in Hyderabad
 Gold Rate in Ahmedabad
 Gold Rate in Pune
 Brokerage Calculator
 Margin Calculator
 MTF Calculator
 Stock Lending Calculator
 Stock Return Calculator
 Stock Average Calculator
 Position Size Calculator
 Compare Indian Stocks
 IPO Return Calculator
 IPO Calendar
 IPO Allotment Status